-
 Story
Story
-
Resolution: Done
-
 Medium
-
None
-
None
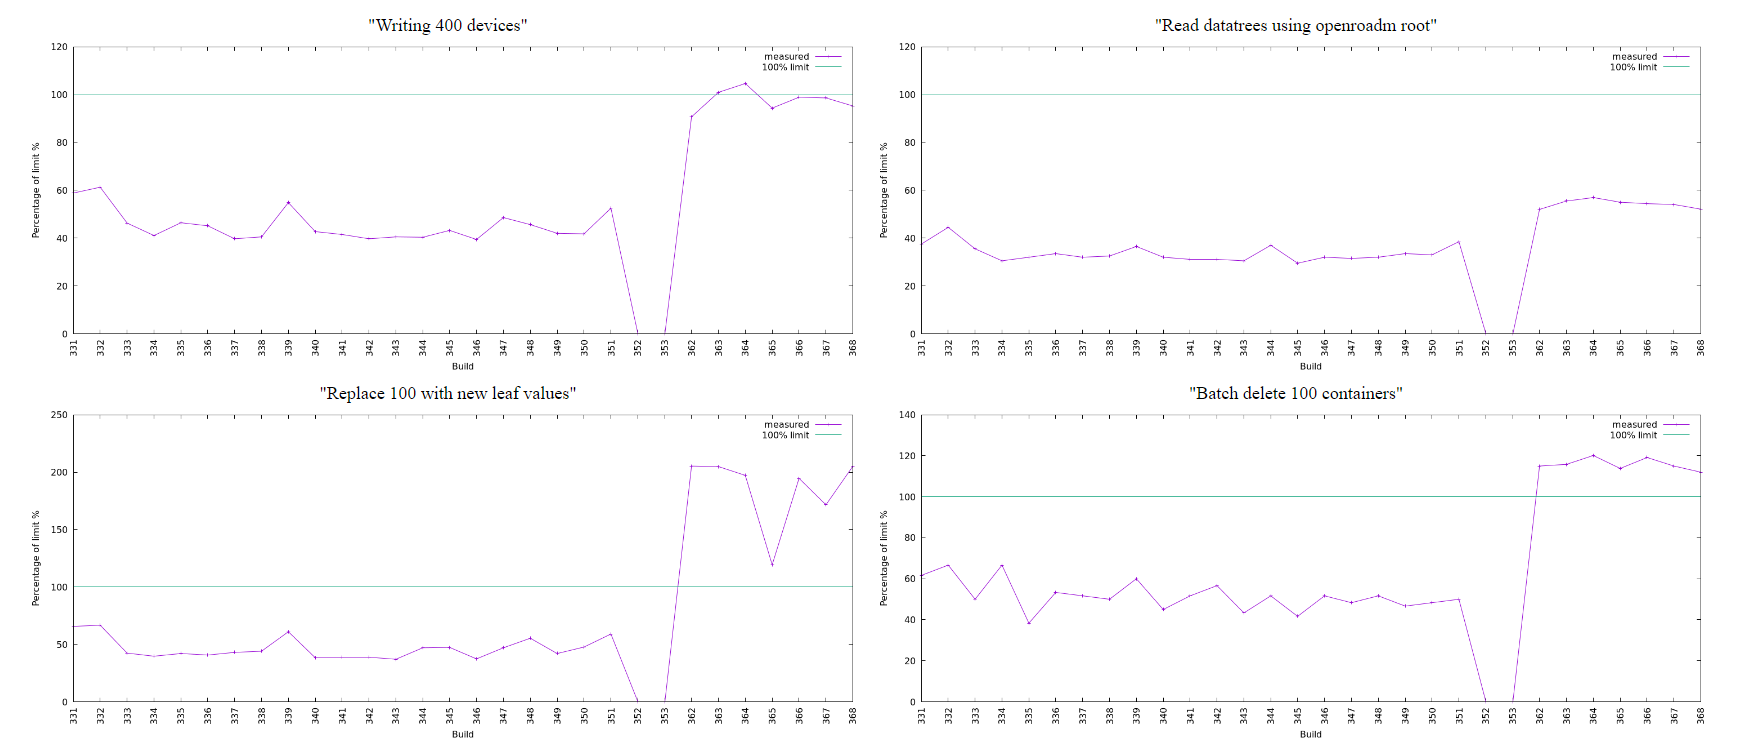
Investigation and fix needs to be done as after moving performance test job to a new server, the performance review plots seems to be imbalanced as seen below
Analyse Performance Data
Goal: Have consistent test results ie. not too much variation!
2 Environments; Physical seems more stable and better control/access
20 Mins to run ALL test, 2 runs per hour!
run 2-3 days ie. 100-150 samples!
- ensure you can capture all the raw data (for ALL tests)
- ensure you can correlate data with time
Import data into Excell
esnuer failures are filted
consider
- calc average
- calc min
- calc max
- calc stdv
- Long term graph for (all ?) Test
- sort on duration : <=100ms, >100ms <1sec, >= 1 sec
- sort on time of Day (for choosen test?