-
 Story
Story
-
Resolution: Won't Do
-
 Medium
-
None
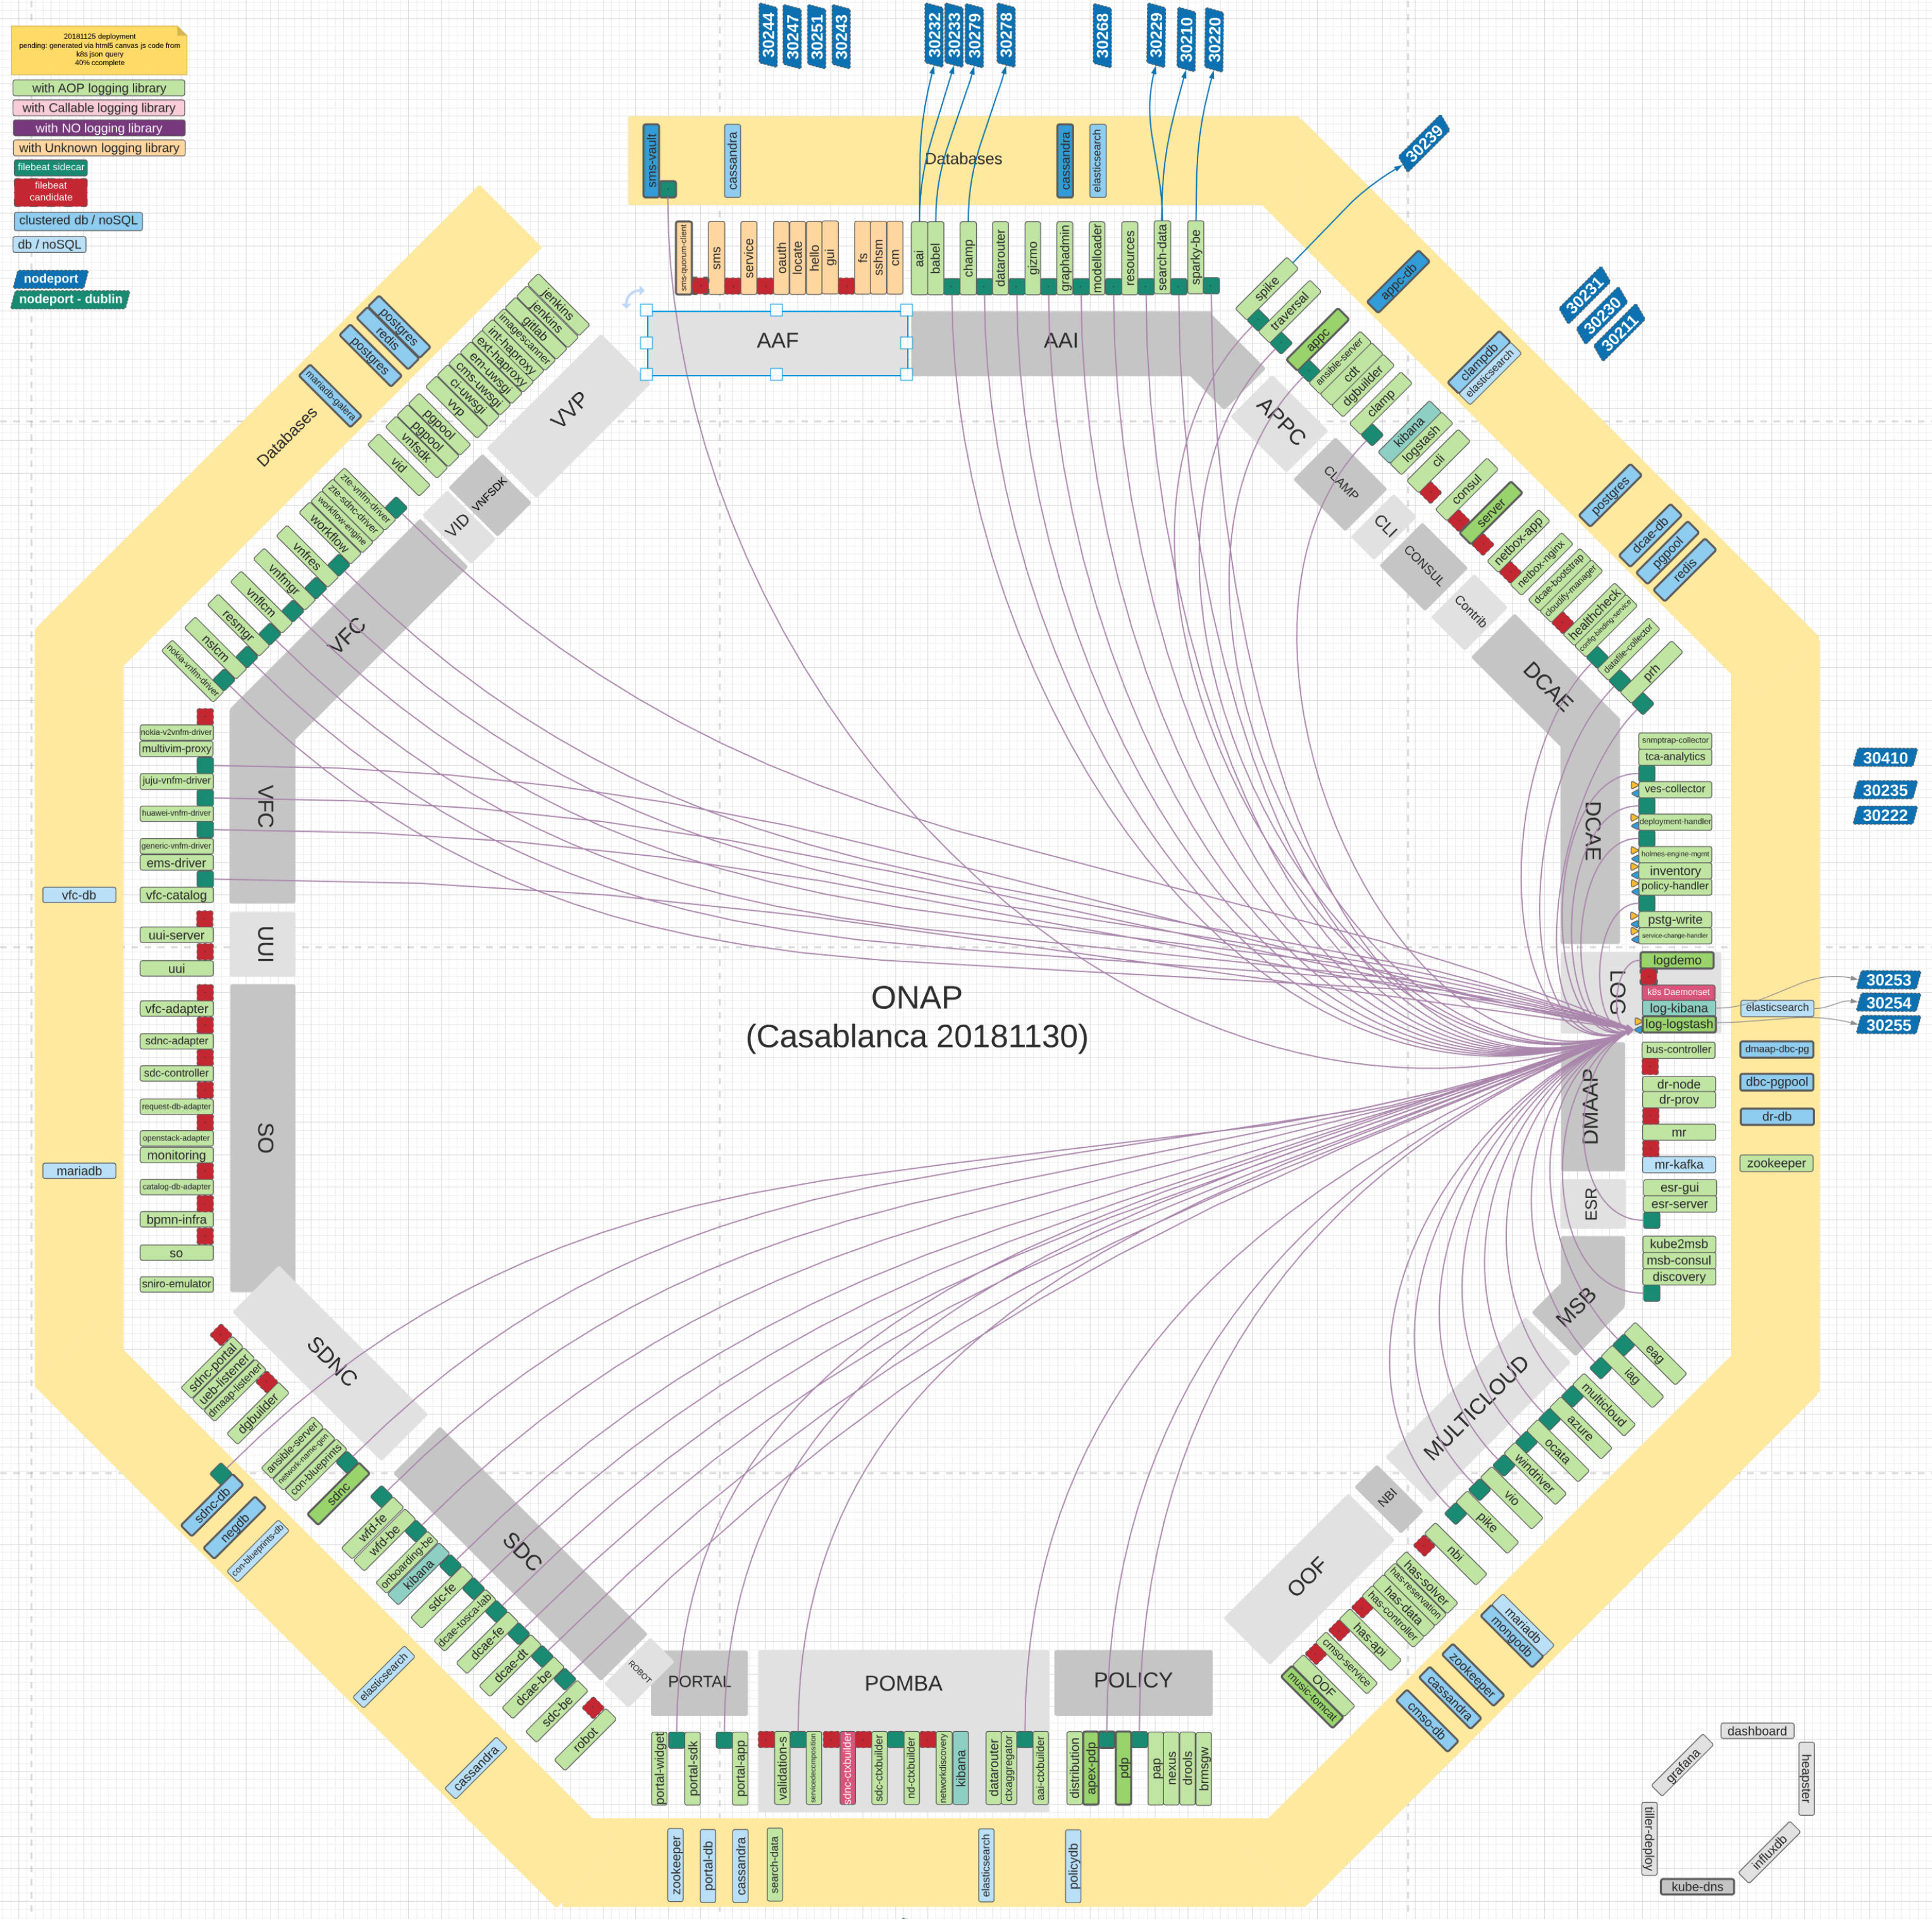
A view similar to this to be automated deployment diagram attached
(In all my meetings - a deployment view more than what we get in kubectl get pods/services is needed - something that also requires going through the code - dependencies/library usage - needed a view of the system to triage filebeat and aop library usage for dublin scope - had to review anyway) - 6h to build manually but I this is a proto of one view of a live automated dashboard - will code up later in in kibana (polling instead of push is ok - can be co-opted for the CD system) https://jira.onap.org/browse/LOG-861 or as part of mike's monitoring epic https://jira.onap.org/browse/OOM-1502
see
https://wiki.onap.org/display/DW/Overall+Deployment+Architecture
https://wiki.onap.org/display/DW/Log+Streaming+Compliance+and+API
https://wiki.onap.org/display/DW/OOM+NodePort+List
https://wiki.onap.org/display/DW/Cloud+Native+Deployment
https://wiki.onap.org/display/DW/Logging+Pair+Wise+Testing+for+Casablanca+Release
- is blocked by
-
 LOG-200
Telemetry capture/processing
LOG-200
Telemetry capture/processing
-
- Closed
-
- relates to
-
LOG-773
Prometheus integration with the Logging ELK stack for OPS
-
.
Must be fixed in any of the upcoming builds and should be included in the current release.")
- Closed
-
-
LOG-911
Add Prometheus charts for kubernetes metric streaming into the LOG ELK stack
-
- Closed
-
- mentioned in
-
Page Loading...
-
-
-
-
-
-
-
-